M&A failure rates are a significant problem for Boards, shareholders and society – the wasted human and dollar capital, the loss of corporate and industry momentum, and the careers destroyed highlight the inadequate tools currently being used to undertake M&A transaction analyses. A 2011 article from the Harvard Business Review claims 70% – 90% of M&A transactions fail, while a more recent McKinsey & Co. study on the energy industry highlights that only 25% of 2011-2022 upstream M&A transactions generated meaningful excess returns. Yet, M&A is a critical strategic tool for companies to enhance scale, pursue growth and develop momentum if done correctly.
When reviewing the literature to understand the reason for high M&A failure rates, many reasons are qualitative such as a clash of cultures, a misunderstanding regarding synergies and/or a failure to execute on the integration plan. Yet this analysis misses another significant cause – the static financial models typically used by companies and their advisors to model the expected financial outcomes. Most M&A professionals, corporate and advisor, still exclusively use Excel; a 30-year-old tool that does not allow us to fully incorporate the dynamic, stochastic reality of most operating and financial variables into our models.
Through using rules-of-thumb and guesstimates for model inputs, the valuation, accretion, return and leverage metric ranges that drive the M&A decision do not fully reflect their real-world variability, and risk. In essence, the financial analysis on which most M&A transactions are based is sub-optimal at best, broken at worst. If we cannot properly model the actual variability of key M&A transaction metrics, and understand their risk and probability of occurrence, how can we expect to increase the probability of M&A success?
The Solution
Fortunately, today, there is an elegant solution to this problem – one that Boards can require of their executives and advisors to facilitate upgraded information on which to make better decisions. And that is achieved by simply converting our static, single input deterministic financial models into dynamic probabilistic models using an off-the-shelf Excel add-in software like @RISK or Crystal Ball; time-tested software that is already used across many companies in multiple roles. It is a change that: (i) will provide an order of magnitude greater insight into all M&A transaction analyses, (ii) is easy to understand and implement, (iii) is cost effective, and (iv) is essential for Boards to fully meet their fiduciary obligations to shareholders to use the best tools, to gain the best insights, to make the best decisions.
A Real-World Example
Understanding the value and insight available from a probabilistic approach to an M&A transaction can only really be appreciated through seeing it in practice. The following analysis reviews the $17 billion Cabot Oil & Gas/Cimarex Energy merger from 2021, based on a Society of Petroleum Engineers paper available on OnePetro.org. This article will compare and contrast the deterministic valuation analysis provided by the two company advisors – Advisor A for Cabot and Advisor B for Cimarex – to the insights available from a probabilistic analysis relying on public information alone.
Exchange Ratio Analysis
In a merger transaction, the Exchange Ratio (Cimarex share price/Cabot share price) is a critical transaction metric; it incorporates the values of the two companies and is used by advisors to opine whether a transaction is “fair, from a financial point of view.” The problem with a traditional analysis is the user of this fairness opinion never knows the probability, or likelihood, of the range of values calculated by the advisors, and whether the agreed Exchange Ratio has a high or low probability of being commercial.
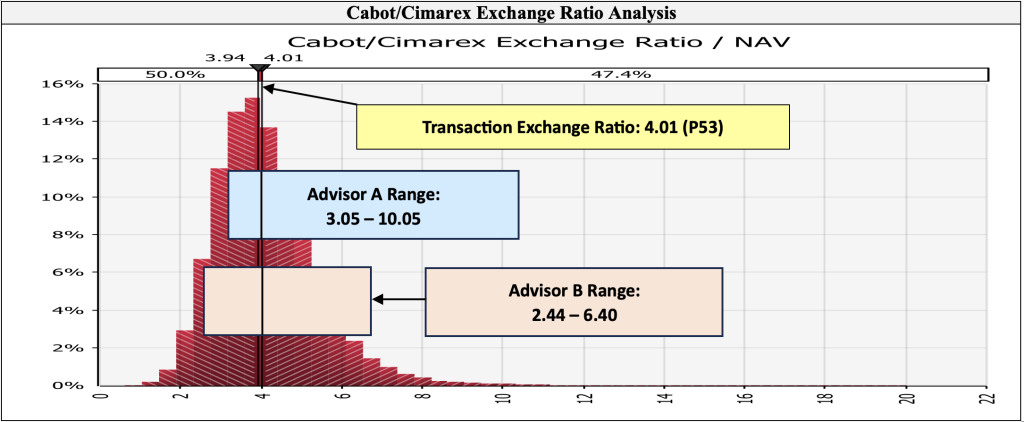
The multiple issues associated with using a traditional approach are highlighted in Figure 1 below. Firstly, Advisor A’s value range, from 3.05 to 10.05, is much wider than that of Advisor B at 2.44 to 6.40; how do Boards know which values to trust given their significant difference? Secondly, the Transaction Exchange Ratio of 4.01 falls at different positions on the Advisors’ ranges; how can we tell which is more correct? Just because the Exchange Ratio falls within a wide range of estimated values does not make it fair or sensible; a greater level of data integrity is required to answer this question.
In this case, the Transaction ratio of 4.01 has a P53 value; there is a 53% probability it could be lower and a 47% probability it could be higher. The median or P50 value is 3.94; the Transaction ratio is only 2% different to the P50 value. This probabilistic approach provides more commercial insight into the reasonableness of the ratio than simply having it fall within a wide range of random values (whose probabilities are unknown) generated by the Advisors.
Accretion/Dilution Analysis
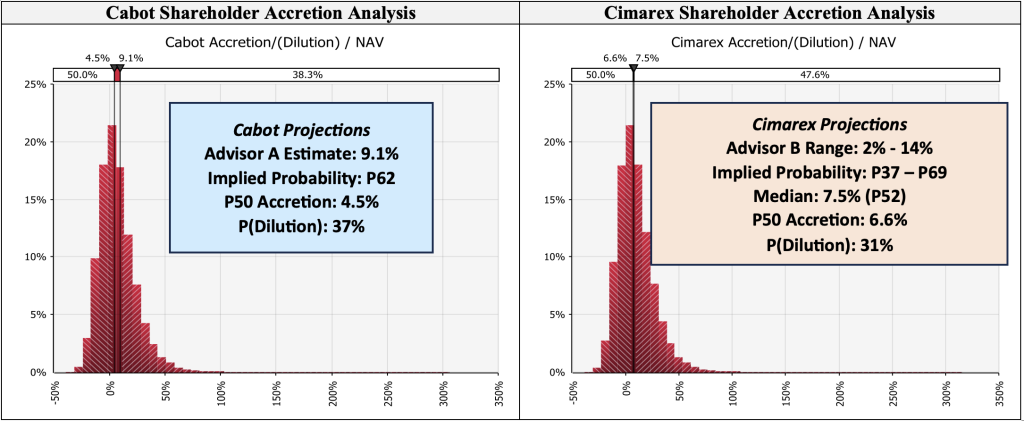
The accretion/dilution analysis is a critical metric to understanding the probability an M&A transaction actually creates value. In this case, per Figure 2 below, both Advisors show the level of accretion they calculated, but provide no sense for its likelihood – a probabilistic analysis will provide this insight.
In terms of Cabot, their Advisor calculated 9.1% accretion. A probabilistic analysis calculates the probability of achieving this value at P62 – there is a 62% probability accretion would be 9.1% or lower. The median or P50 accretion calculated is 4.5% (half of the Advisor’s estimate) while the probability of dilution, a critical Transaction success metric, is 37%. There is a greater than 1 in 3 chance this Transaction, including estimated cost savings, will be dilutive to Cabot shareholders – isn’t this an important insight Boards and shareholders would want to know?
In terms of Cimarex, their Advisor calculated accretion of 2% to 14%, with a median of 7.5%; the probabilistic analysis calculated this range was quite reasonable (as it fell in the middle of the likely range of values) with the 7.5% median representing a P52 value; the median P50 value was calculated at 6.6%. The probability of the Transaction being dilutive to Cimarex shareholders was 31%, slightly lower than 1 in 3 but still a material insight for Boards and shareholders. Knowing the probability of dilution can facilitate the implementation of strategies to mitigate this risk if the Board deems it appropriate – an option not as possible with a traditional financial model approach.
Equity Risk Analysis
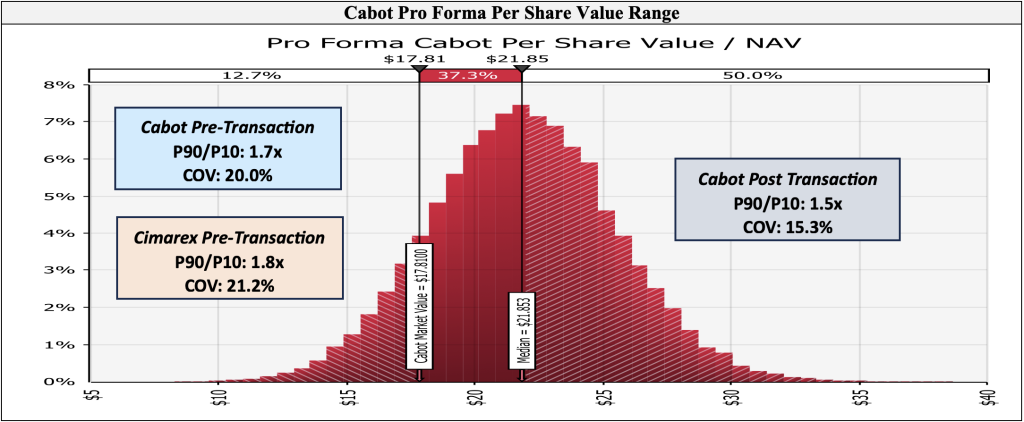
Understanding how risk changes for shareholders is a critical metric that cannot be properly evaluated using a traditional M&A analysis, even though Proxy Statements often contain pages of insights into why risk is expected to decline. Using a probabilistic analysis provides the range of data points required to generate two statistics engineers use to evaluate risk; the P90/P10 value, and the Coefficient of Variance (COV) which represents the standard deviation divided by the mean. In Figure 3 below, the changing risk profile for Cabot and Cimarex shareholders is highlighted.
In this case, Cabot shows a P90/P10 value of 1.7x and a COV of 20.0% while Cimarex shows values of 1.8x and 21.2%, respectively. Pro forma for the Transaction, the shareholder risk metrics decline for both sets of shareholders with the P90/P10 at 1.5x and the COV at 15.3%. This shows an average 22% decline in variability, or risk, for the respective shareholders; a critical insight for Boards and shareholders only a probabilistic model can provide.
Conclusion
With a probabilistic financial analysis advisors can generate quantitative insights critical to more fully understanding M&A risk/return metrics not otherwise possible using traditional financial modeling. In this example, a probabilistic approach provided unique, value-added insights to more strongly, objectively support the Board’s decision: (i) the Exchange Ratio has a P53 value supporting the opinion it is “fair”, (ii) there is a 63%-69% probability the Transaction will be accretive to shareholders, and (iii) pro forma shareholder risk will decline an average of 22%. These insights bring a degree of integrity to the M&A analysis process not otherwise possible using regular Excel models.
As Boards, shareholders and advisors seek to enhance the probability of M&A success, it is vital we upgrade our modeling approach to have the transaction data reflect the actual variability of the key metrics – a probabilistic Excel add-in being the elegant, simple-to-use and cost/time effective upgrade to achieve this. With this tool and enhanced transaction insights, we can significantly improve the M&A evaluation and risk analysis process to make better decisions. And ultimately add significant value for shareholders through achieving a higher probability of transaction success – the holy grail Boards and advisors should seek given the disappointing M&A failure rates experienced today.


